Track your progress over time
How to tell whether your AI visibility is actually improving — the History tab, the Analytics trend, and filters that isolate what changed.
One check is a snapshot. The real question is the trend — is AI mentioning you more this month than last?
History — every check you ran
The History tab lists every check, newest first. Click any one to open its full breakdown. Turn on the daily Scheduled check (in Run check → Advanced) and this fills in on its own.
Analytics — the trend line
The Analytics tab plots your Visibility Rate over time, check by check.
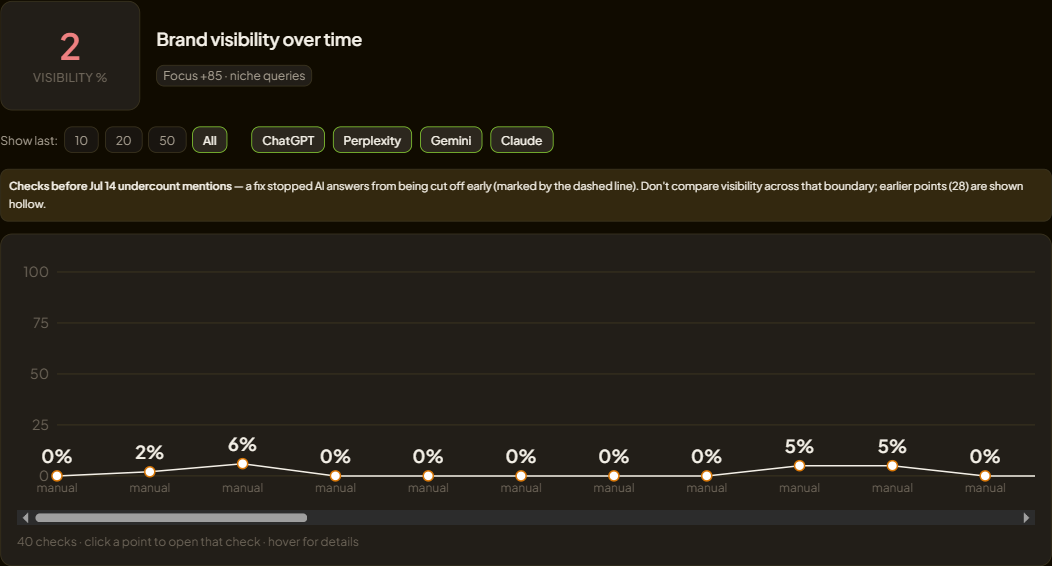
A rising line means AI is naming you more often. A flat line after you made changes means those changes did not move the needle — useful to know.
Filters — isolate what changed
Above the graph you can filter by check, bank, or question level. That is how you answer specific questions:
- Did my Niche visibility improve after I added specialty pages? Filter to L4.
- Am I weak on one platform? The breakdowns split it out.
- Did a specific bank do better? Filter to it.
The whole point
Make a change — add schema, get cited somewhere, publish a page — then run checks before and after and watch the number. That loop, do something → measure the effect, is what turns AI visibility from guesswork into something you can steer.
Next: Finding your weak spots.
Keep reading
Running checks and reading results
How to run an AI visibility check, choose how deep to ask and which assistants to use, and read everything that comes back.
Query banks — and steering them with comments
What a query bank is, the four question levels, how to build and top it up, and the trick most people miss: steering generation with comments.